Speed to Profit: What Happens to Your Cash When FBA Inbound Takes 43 Days
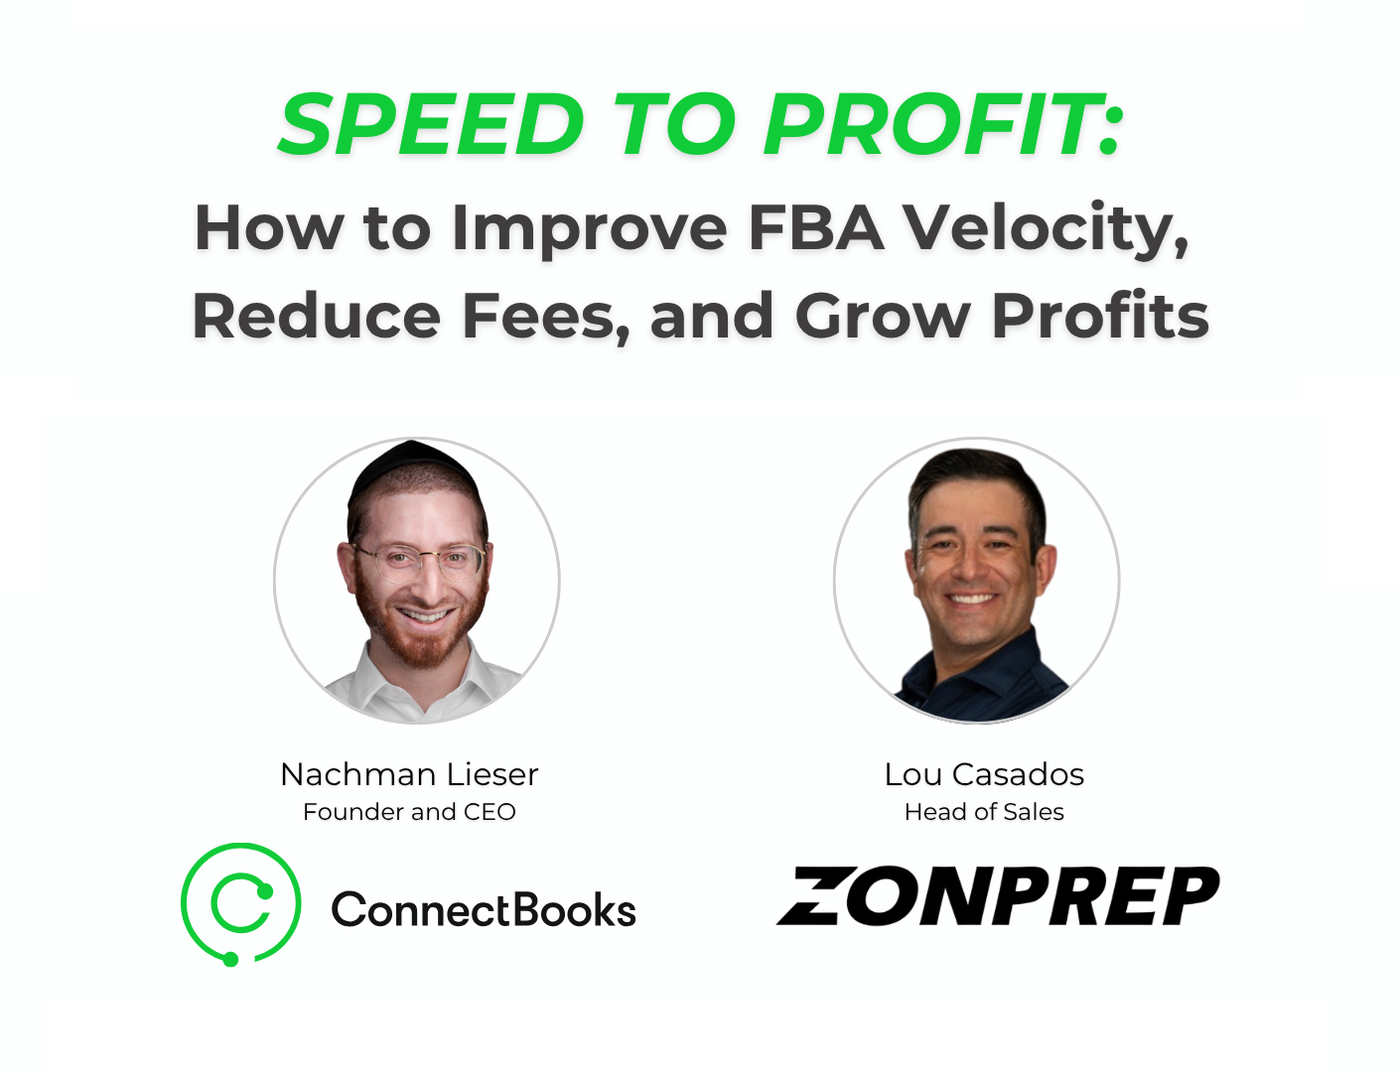
We got together with ConnectBooks yesterday week to run a session called Speed to Profit. Lou Casados took the operations side, ConnectBooks founder Nachman Lieser took the finance side, and the whole point was to connect two things most sellers manage in separate rooms: how fast your inventory moves through Amazon's inbound network, and how much cash your business has in the bank at the end of the month.
They are the same problem. Here is the recap
The placement fee is the cost you see. The 43 days is the cost you don't.
Start with the decision most operators make on a spreadsheet in about four minutes.
You build a shipment plan. Amazon offers you the choice: send everything to one location and pay the inbound placement fee, or split the shipment across regional destinations and pay nothing. You price out five LTL shipments across the country, compare it to the placement fee, and the fee wins. So you pay the fee, tell yourself you optimized for cost, and move on.
Lou's argument on the webinar is that you didn't optimize for cost. You optimized for the part of the cost you could see in Seller Central that afternoon.
Here is what you actually bought. A single-destination shipment lands at a national inbound cross-dock. Amazon runs its algorithms, decides where your units belong, and starts splitting them out to regional cross-docks and then on to fulfillment centers. Once it checks in at the national cross-dock, your inventory shows as sellable. That is a misrepresentation of what it can do, because it is not Prime eligible until it lands at the final fulfillment center. In the meantime you are staring at an FC transfer screen with ten to twenty destination codes on it, watching units trickle toward eligibility.
Prime eligibility is not a badge. It is a conversion mechanic. Lou's read is that conversion rates improve by roughly 23% or more on products that are Prime eligible versus products that aren't, which means every day a unit spends in FC transfer is a day it converts at a rate you would not accept if you saw it on a dashboard.
Stage by stage, that journey runs roughly: seller's warehouse to national cross-dock, 10+ days. On to a regional cross-dock, 30+ days. On to the fulfillment center, 43+ days. And check-in time sits on top of all of it. Across the industry, check-in alone ranges from 7 to 43 days depending on how you ship.
Call it what Lou calls it: an operational tax. You didn't avoid a cost. You converted a visible fee into 43 days of invisible one.
Then it compounds. If your inventory takes 43 days to become fully Prime eligible, you are not carrying 45 days of on-hand cover. You are carrying 90 to 120 days, because nobody wants to be the person who let a top ASIN go dark. Then Q4 arrives, storage rates step up for the October through December window, sometimes as much as 3x depending on category, and you pay a premium to store the buffer that the slow inbound process forced you to build in the first place.
Amazon isn't punishing you here. This is worth saying plainly, because the internet gets it wrong constantly. Amazon introduced the inbound placement fee in March 2024 as part of formalizing a regionalized fulfillment network. The fee is a tax on inefficient shipping strategies, not a penalty. Amazon wants inventory landing close to demand on day one, and it removes the fee entirely when you do that. Sending optimized splits is not a workaround. It is using the system the way it was designed.
Do that, and you skip the national cross-dock entirely. Product goes straight to the regional level, which takes 20 or more days off the FC transfer process.
Lou brought a live example to make the gap concrete, and the useful thing about it is that it is one brand measured against itself. A supplement brand sending just under 3,000 pallets a year into FBA. Before working with us, it took 19 days from creating a shipment to getting checked in at Amazon and starting the receiving process. That brand was paying placement fees about 40% of the time and optimizing its splits the other 60%. Same brand, same SKUs, same quarter: the 40% paying placement ran 26 days to Prime eligibility. The 60% shipping optimized ran 6 to 8 days.
That is not two companies with different capabilities. That is one company making a shipment-level decision twice a week and getting two completely different businesses out of it.
Every extra week of cover is a specific amount of cash sitting on a shelf
This was the part of the session where the chat got quiet.
Nachman's framing: when he asks a seller how much money the business made last month, he gets an answer immediately. When he asks how much inventory is on hand, he usually gets a pause. When he asks how much of that inventory has been sitting past 90 days, or past 180, he almost never gets a number at all.
So he does the arithmetic out loud. Take a $2 million inventory position turning every 90 days. Roughly three months of cover, call it twelve weeks. Divide it out and one week of inventory is about $166,000. That is the price tag on a single extra week of cover. Not the financing cost of the week, not the interest: the actual cash locked in goods that are doing nothing for you. Carry $10 million and multiply accordingly.
Now connect it back to the first section. The extra weeks of cover are not a purchasing preference. They are the direct output of a slow, unpredictable inbound process. You are not choosing to hold 120 days. Your check-in times are choosing it for you.
And that cash has somewhere better to be. Lou's point: it isn't only about buying more units. It is ad budget, it is PPC, it is the things that actually drive conversion and top-line growth, all of it currently immobilized in a cross-dock in a state you have never visited.
Nachman then took it a layer deeper into inventory age, which is the version of this problem that quietly kills good businesses. He walked through an analysis of a seller doing around $70 million a year, sitting on roughly $9 million of inventory. The $9 million was not the alarming part. The alarming part was that $2.6 million of it was older than 180 days, including about a million dollars older than a year.
His line on that: when you buy a product for $50,000 planning to sell it for $100,000, you book a $50,000 profit in your head on day one. If you never sell it, that product is not profit. It is a loss you have not recognized yet.
He closed the finance argument with an example that should be printed and stuck to a wall. A seller doing $22 million in sales with $1.4 million in net income. Genuinely good business. Empty bank account. Where did the $1.4 million go? Into inventory. They started the year holding $3 million of stock and ended it holding $6 million. They out-bought their own sell-through and never noticed, because volume was growing and nobody was watching the balance sheet. The goal, as he put it, is to make the $1.4 million, start the year at $3 million of inventory, and end it at $3 million.
(The finance figures above are ConnectBooks client examples that Nachman presented on the webinar, not ZonPrep data.)
The forecasting problem isn't slowness. It's variance.
This is the sharpest thing Lou said all session, and it reframes the whole conversation.
Sellers think their inbound problem is that Amazon is slow. It isn't, or at least that isn't the expensive part. The expensive part is that Amazon is inconsistent, and inconsistency is what makes forecasting impossible.
One shipment checks in in 5 days. The next takes 14. One batch hits Prime eligibility in 8 days, the next in 43. Every one of those data points goes into your inventory planning, and collectively they tell you nothing. You cannot build a replenishment model on a range that wide. So you stop modeling and start over-buffering: send 120 days of cover, because at least then you won't stock out.
That is not a strategy. That is a hedge against your own missing data.
Flip it. If you know that no matter what, your product checks in within a fixed window and hits Prime eligibility in single-digit days, your entire operation changes. Nachman's version of this is a weekly replenishment rhythm: consistent volume, every week, forever. What blocks sellers from running that rhythm is FC transfer limbo. When shipments disappear into a black box for weeks, you stop sending weekly and start sending two months at a time, which spikes your cash outlay, empties the account, and forces you to wait. Predictable inbound is what makes lean replenishment possible.
Lou's framing of the target: run as lean as you can. There is a narrow band above Amazon's low-inventory-level threshold and below the point where you risk stockouts, and that band is where the healthy operators live. You can only find it if your inbound times are reliable enough to trust.
For what it is worth, this is the mechanism behind our own numbers rather than a claim about how hard we work. We quote a 5-day SLA year round, measured from when your product arrives at our facility to when it gets to Amazon, and that number does not move for Prime Day, Prime Big Deal Days in October, back to school, Black Friday, Cyber Monday or Q4 peak. It is 5 days or less regardless of the season. What clients actually saw through June was just over 36 hours from leaving our facility to checking in at Amazon.
Set that against the alternative. Amazon's fastest time to Prime when you pay placement fees and ship to a single location is 26 days, plus whatever check-in took. The gap is not effort. It is which door you go through.
Time to Prime eligibility figures are based on actual shipment data from current ZonPrep clients, tracked and verified by our team. Individual results may vary based on product category, shipment volume, and Amazon receiving conditions.
Stockouts cost more than the sales you didn't make
Both sides had something to say here, and the two answers stack.
Lou's operational read: the two biggest causes of stockouts in high-volume accounts are prep delays and inefficient inbound modes. Item-level work is where prep timelines quietly blow out. FNSKU labeling, Transparency, kitting, bundling: every one of those means touching each unit, labeling it, reboxing it, applying carton labels, then building shipment plans. Sellers regularly tell us their current provider takes 5 to 14 days before a project even leaves the building. Add that to a 43-day FC transfer and you can see how a well-planned replenishment ends up as an out-of-stock ASIN.
Nachman's financial read is the one sellers underweight. The lost sales are obvious. The expensive part is rank. You lose it in days and you buy it back over months, first with organic rebuild and then with ad spend. And when you finally get the rank back, your margins often don't come back with it. He has watched sellers return to their old rank at a 25% ACOS where they used to run 20%. At $1 million or $2 million in sales, a couple of points is real money, and it persists long after the stockout is a memory.
Then there is the air freight decision, which is what sellers reach for when the stockout is already happening. That cost is entirely avoidable upstream.
What to do before Q4, in the order we would do it
The session closed on Q4 prep. Five things, roughly in priority order.
1. Calculate your true blended per-pallet rate. This is the number Lou pushes hardest, and it is one line of arithmetic:
-> (placement fees + freight + prep) ÷ pallets shipped = your true per-pallet rate
Most operators evaluate prep providers on a per-unit prep price, which is the one component that cannot see the other two. Blend all three into a per-pallet figure and you usually discover your real cost lives somewhere you weren't looking. Run it tonight against your last full quarter.
2. Lock your rate lanes. Go to your freight brokers now with an honest volume forecast for a specific lane over a specific period and get rates locked before Q4 pricing gets volatile. Then hit the volumes you promised.
3. Check your prep for dimensional slack. Deeply unglamorous, frequently expensive. If you are polybagging, there is a decent chance you are handing Amazon dimensional readings larger than your product. A 7-inch polybag on a 4-inch product means you pay FBA fulfillment fees on three inches of air, on every unit, forever. We ran this analysis for one large enterprise brand and found it was spending over $2 million a year in FBA fees it did not need to spend, purely because of excess slack on a handful of items. Brands almost never audit their own prep compliance, which is exactly why the number gets that big before anyone notices.
4. Get your split strategy right, and know the 5-box rule. At 5 or more boxes per SKU, Amazon's split options open up. Above that threshold, splitting beats paying placement every time. It is Amazon's own feature at Amazon's own threshold, and it is the single most checkable thing on this list: pull your SKU list this afternoon and see which ones clear it.
5. Budget year round, not in October. Nachman's point, and a fair one. The sellers scrambling in Q4 are not scrambling because Q4 is hard. They are scrambling because they have never run a monthly cash flow analysis, and they have never run one because the books were never in a state that allowed it. Also worth knowing: not every category makes money in Q4. Storage rates step up for October through December, sometimes as much as 3x, and for some SKUs the honest answer is that selling through peak is worth less than removing the inventory before it gets expensive. Removal has its own fees, so "just sell it out" feels like the cheaper path and often isn't. You cannot make that call without item-level fee visibility.
Where the two halves meet
Lou's one-word answer, when asked what has the biggest impact on cash flow, was speed. Speed to sellable, speed to Prime eligible, speed to back in stock. Nachman's was visibility: knowing which products earn, which drain, and where the money actually went.
Neither one works alone. Speed without visibility means you move faster in a direction nobody has verified. Visibility without speed means you can see the problem in high resolution and still can't fix it.
For our part, the operational side of that equation is what ZonPrep is built for. Consolidation runs through 600,000 square feet across two warehouses in McDonough, Georgia, which sits within one-day ground of about 80% of the US population and inside Amazon's preferred routing zone. You send one truck to one place. We build the optimized splits, consolidate with other volume heading to the same regional facility, and send floor-loaded FTLs into Amazon's regionals against live unload appointments booked 21 days out. Floor loading matters more than it sounds: Amazon's regional facilities receive by conveyor, so a floor-loaded truck forces immediate receiving, while palletized freight can get sidelined until someone depalletizes it. We are listed as a carrier in Amazon Carrier Central, we hold that 5-day SLA 365 days a year, and we run a 99.9% accuracy record across more than 100 million units shipped. In 2025 our clients paid $15 million less in Amazon inbound placement fees than they otherwise would have (upon validation, this number is upwards of $45M). Onboarding takes about 15 minutes.
If you want the version of this conversation applied to your own numbers, that is what the ZonPrep FBA Opportunity Analysis is: a side by side of your current inbound operation against the same volumes run through ours. Start at zonprep.com, or find Lou on LinkedIn.
Q4 is close. Go run your per-pallet number.
Related reading. This piece covers what slow inbound does to your cash. If you want the measured version, the before-and-after lead times from our client opportunity analyses are published on the Results page, updated monthly with the date range on every figure. For the operational side, the four levers that still move Q4 in mid-September, read Four Tips to Get Inventory into Amazon Faster in Q4.